A couple of weeks ago I rebuilt my Discord bot as a real project. Cogs, Docker, GitHub Actions, GHCR, semver tags. The whole rebuild ended at v0.1.0 with a working release pipeline and the explicit promise that v0.2.0 would be a web dashboard. Followed through.
This post is shorter than the first one because most of the interesting decisions were made the first time around. The dashboard is just one more feature riding on top of the architecture I already had. Which is sort of the point of doing the architecture properly the first time.
what it actually is
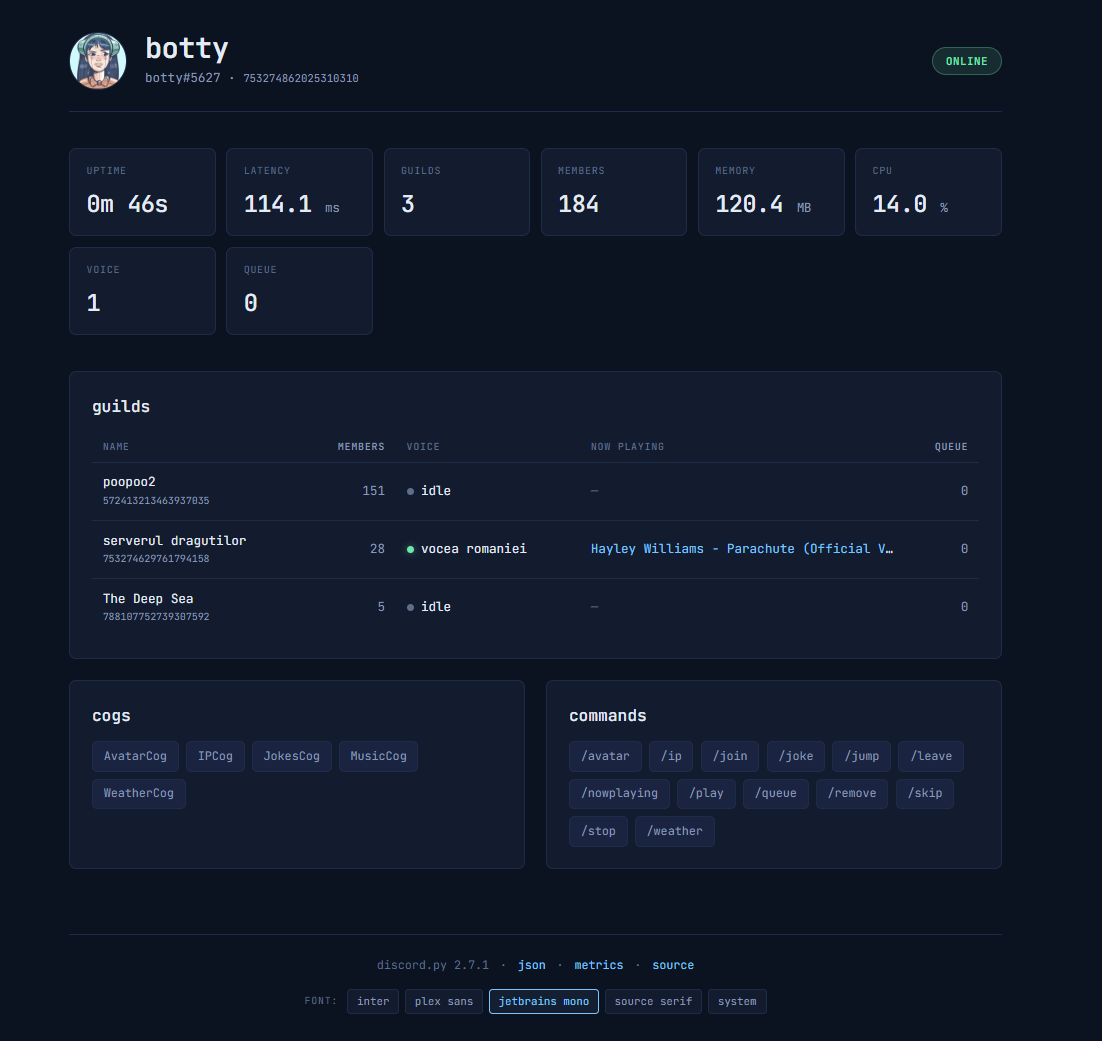
A FastAPI app that runs in the same process as the bot. Three endpoints that matter: a server-rendered HTML status page at /, the same data as JSON at /api/status, and a Prometheus metrics endpoint at /metrics. Plus a /healthz for Docker's healthcheck. All of it on port 8080, all of it served by uvicorn as an asyncio task on the bot's event loop.
It's behind Authentik via Traefik forward auth, same pattern as everything else in my stack. Lives at botty.hexie.dev. (behind authentik SSO though... will make a user for you guys to see it 😊)
same process or sidecar
The interesting design decision, and the one I had to actually think about, was whether the web server should run inside the bot's process or as a separate container talking to the bot over IPC.
Sidecar is the "microservices" answer. Two containers, clean boundaries, one can crash without taking the other down. In exchange, you have to invent some way for them to communicate. Redis pubsub, an internal HTTP API, a shared SQLite, something. And every piece of state the dashboard wants to display now needs to be serialized, transmitted, deserialized.
Same-process is the dumb answer that turns out to be right. The web routes have a reference to the bot object. They call bot.guilds and bot.cogs directly. There is no IPC because there are no two processes. The downside is that an exception in the web server could in principle take down the bot, which I addressed by wrapping the uvicorn task in a try/except that logs and contains failures. In practice uvicorn is well-behaved and this has not come up.
For a personal bot serving one person, the sidecar pattern is cosplay. The same-process design is ~80 lines of glue code total, and the dashboard renders real-time data with no scraping lag because it is reading the bot's actual memory.
why prometheus too
I almost did not include the Prometheus endpoint. The HTML dashboard is the showcase piece. The metrics endpoint is operational hygiene that nobody looks at directly, and adding it means another dependency, another route, another thing to maintain.
But the cost is genuinely tiny. The prometheus-client library is small and stable. Adding an endpoint that exposes counters and gauges is about thirty lines. And the upside is that I now have a Prometheus-scrapeable bot that fits cleanly into my existing observability stack. Grafana can graph it. Alertmanager can alert on it. Six months from now I will have actual historical data about how often I run /play and how many guilds the bot is in over time. None of that is possible if I had only built the live HTML page.
The two endpoints share an instrumentation layer. Counters get bumped from a tree-level error listener and a command completion listener on the bot itself. Cogs do not need to know about metrics. New cogs added in the future will be instrumented automatically without me writing a single line of metrics code in them.
auth
I had originally pitched making the dashboard public on the basis that "it is read-only, what could go wrong." Talked myself out of it.
The page exposes guild names and IDs (my Discord social graph), now-playing tracks (behavioral signal), and a public scrape target that any script kiddie could hammer at ten thousand requests per second. None of that is catastrophic. All of it is unnecessary to expose. The cost of putting Authentik in front is one Traefik label block I copy-pasted from another service. The cost of leaving it open is a permanent public record of metadata about my bot, indexed forever by archive.org and Shodan within a week.
For showcase purposes I have a screenshot in the repo readme, which is what 99% of people who care will look at anyway. The live URL is for me.
tagging
The whole thing shipped via the v0.1.0 release pipeline I built last time. git tag v0.2.0, git push --tags, watch the Actions workflow build the multi-arch image, watch the release page get auto-generated with notes pulled from commit messages, docker compose pull && docker compose up -d on the Proxmox host, done.
This is the part of the project that I am most proud of, honestly. The dashboard is fine. The release flow is what makes the project feel like a real piece of software. v0.2.0 took maybe three hours of work to build and zero work to ship. That ratio is what good infra buys you.
what is next
I left a roadmap in the readme with a few candidate v0.3.0 directions. SQLite for persistent per-guild settings is the obvious one if I want the bot to actually remember things across restarts. A committed Grafana dashboard JSON in the repo would close the loop on the metrics work. More cogs whenever I have a use case for them. Nothing burning. The bot is in production, doing its job, and the dashboard means I can actually see it working.
Repo at github.com/hexiejexie/botty-discord. Image at ghcr.io/hexiejexie/botty-discord:0.2.0.